Using the hub
Your dashboard
The Dashboard is your account at a glance — balance, spend, what you’ve built, and your public reach across every project. Open it from Home in the left rail.
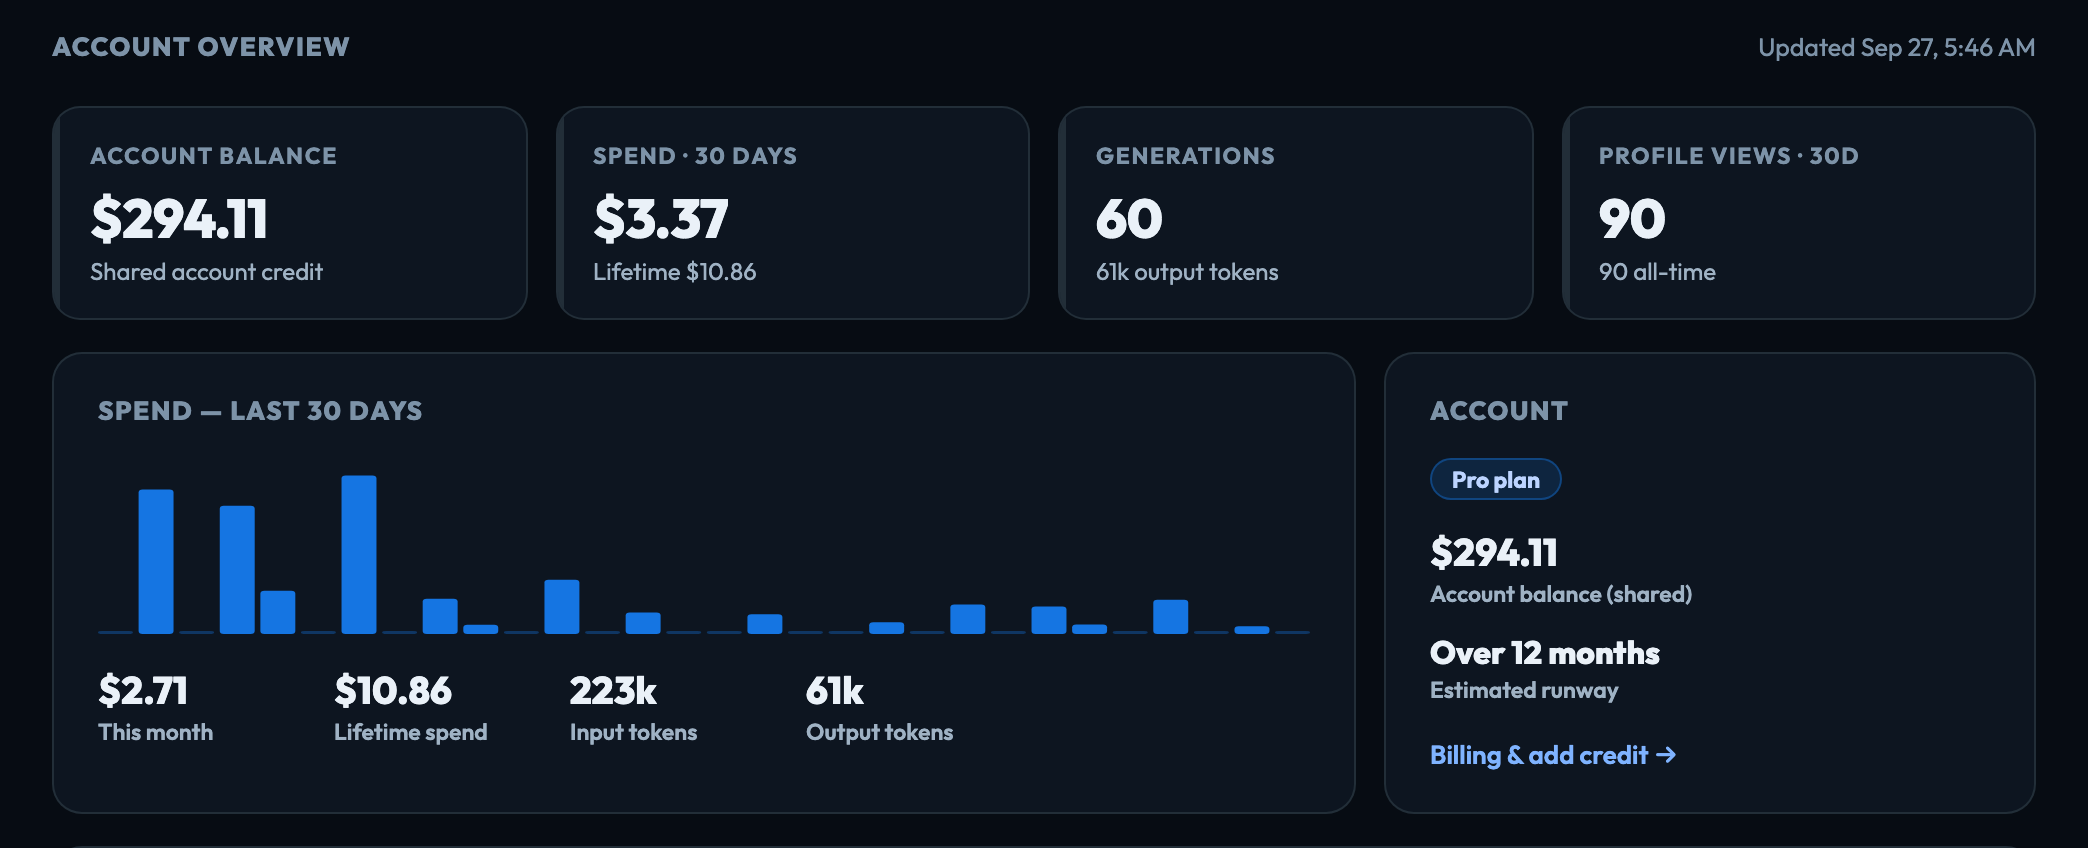
The top numbers
Four cards summarise the account: Account balance (shared credit), Spend · 30 days (with lifetime spend), Generations (with output tokens), and Profile views · 30d (with all-time views).
Spend and account
A 30-day spend chart sits beside an Account card showing your plan, the shared balance, and an estimated runway at the current pace. If the balance is low, or you’re near your monthly cap, a flag appears here.
At the bottom of the card, someone who can add credit (the owner, or an admin with billing access) has a link to Billing & add credit. Everyone else sees which account owner to ask for more credit. Who can see and manage billing
Content
The Your work section counts your Projects, Documents, Datasets, Skills and Prototypes, then lists each project with its docs, data, skills, prototypes, and whether it’s Published or Draft.
Public reach
If you’ve made anything public, the Public reach chart and Most viewed list show profile, project, and document views over the last 30 days, plus your all-time total and a link to your public page. Nothing here is public until you choose to publish it — see Your public profile.
Signed in to VeraGen? Press Guide me on any screen for a walkthrough, or ask Odin.